
Ticket to Ride, Belgium style.
This is not a map. This is hours of fun on a sheet of paper. Met with a lot of free time during one of the past lockdowns, I decided to make a long lasting dream come true. Combining my love of board games with my knowledge of map making and the railway enthusiasm of my friend, we finally set about creating our own version of the Ticket to Ride board game, Belgium style.
It would take us too far to explain all the rules of Ticket to Ride, but it boils down to getting routes (which are two random cities you need to connect to one another), drawing coloured cards that match the segments and then putting your trains on the board. In the end points are rewarded for each completed route, each segment and extra points for the shareholders of the railway companies.
So, how does one go about making a board game map? Not only does the map have to look good, it also has to be the right size and scale, and most importantly it has to be playable. This adds some extra constraints, like the number of segments, the length of the segments, the distribution of the colours, and so on.
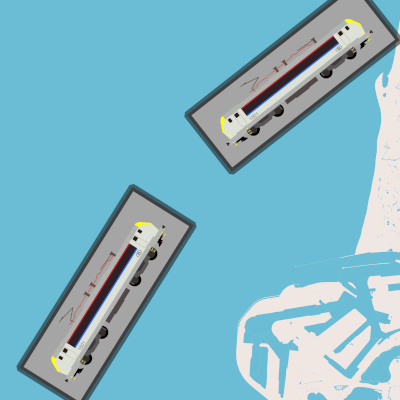
One starts simple, in QGis with a printout of country borders and railways from OpenStreetMap in the same aspect ratio as the Ticket to Ride board. Using posterazor, we then printed this to multiple A4 sheets and with scissors and tape transformed it into a map the exact size of the board. This can be used to identify possible railway lines to use in the game, as well as key intersections. Using the trains from the game we could also estimate the length of segments between intersections.
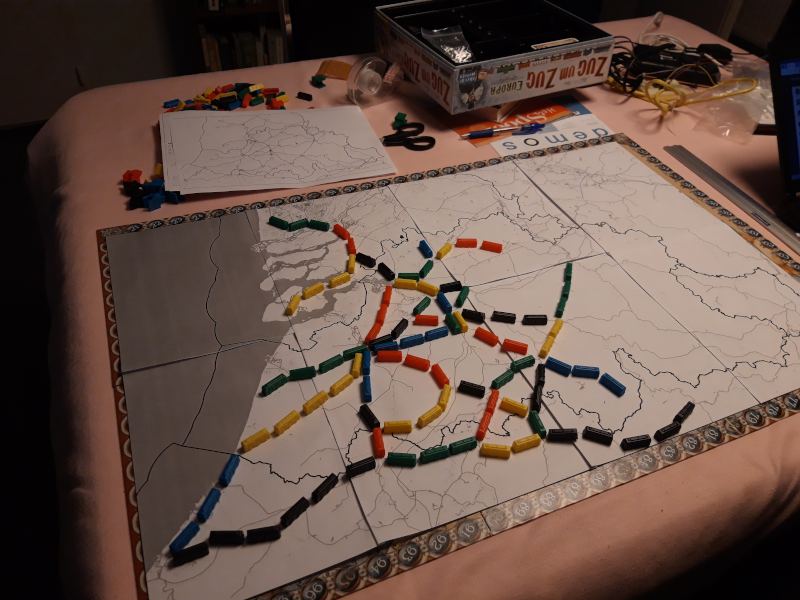
First printed version of the map, with trains on it to determine intersections and segments.
Once we identified the segments and intersections (cities) to use, the map was exported from QGis as SVG and imported into Inkscape, where we could add the rectangles. From then on, the map would be made up of two parts: the basemap (which was still very basic at this point) made in QGis, and an overlay with the 'game' parts made in Inkscape. Both are rasterized as PNG and combined in GIMP.
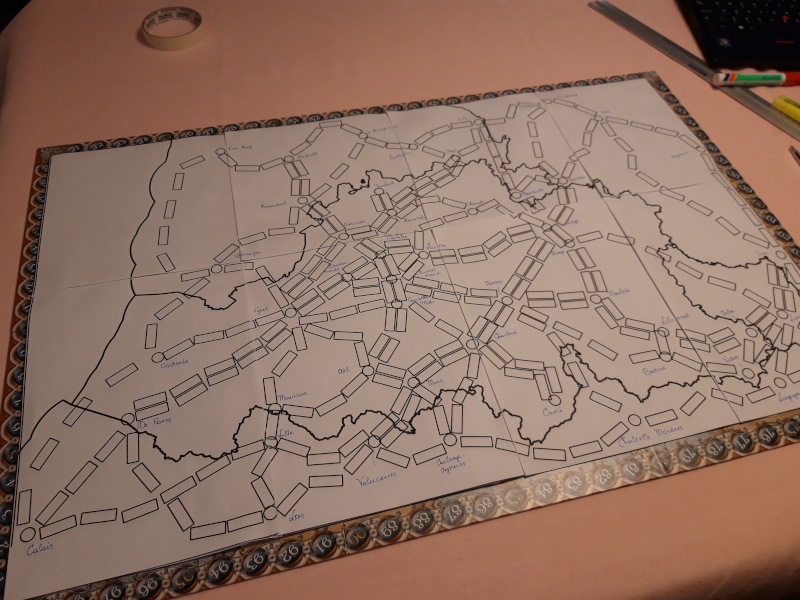
Second iteration of the map, with intersections and segments printed on it. No colours or labels yet.
While identifying possible segments and intersections was initially done just by knowledge of the rail network and fiddling with the trains, somewhere around this point we started to realise that in order for the game to be playable, we'd need to match the original games' number of rectangles, and also the distribution of rectangles into segments (e.g. we could not only have short or long segments) and the distribution of colours to segments (since they need to match with the available cards).
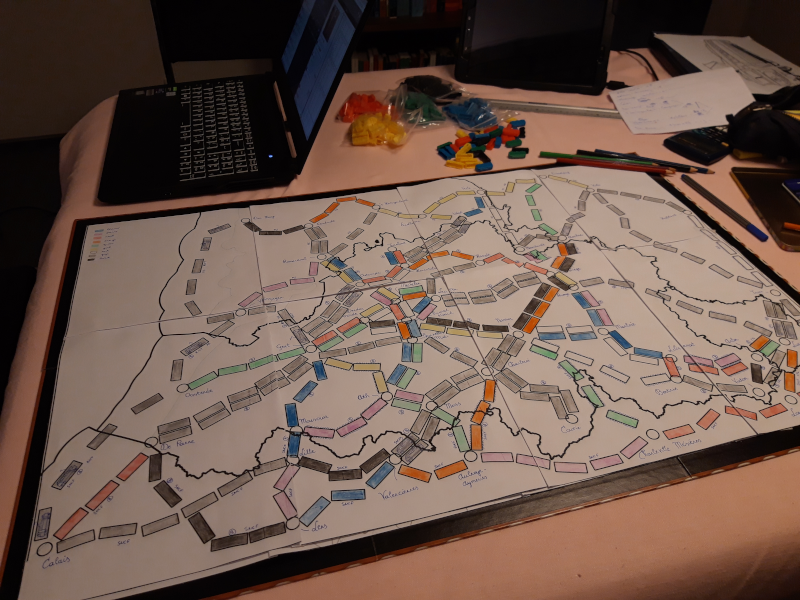
Printed map with segments coloured in with pencil.
After some iterations, which we went through by printing and colouring (with pencils due to lack of colour printer), we settled on what more or less resembles the final result. The intersections and the segments were final now, both in length and colour.
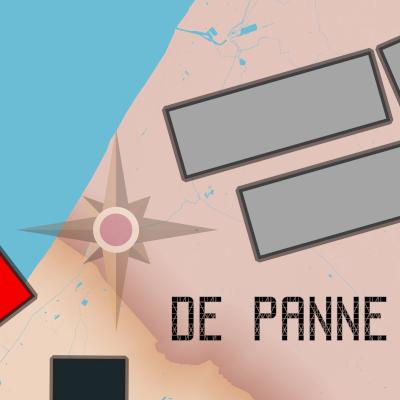
Railway connaisseurs will notice that not all of the segments on the map actually still exist today, or have even existed in the past. For reasons of gameplay we decided not to be too strict in following lines you can ride today. For example the line Calais - De Panne does not exist anymore today, which also holds true for De Panne - Lens. Also the line Gent - Vlissingen via Terneuzen and a ferry across the Westerschelde (sadly) does not exist.
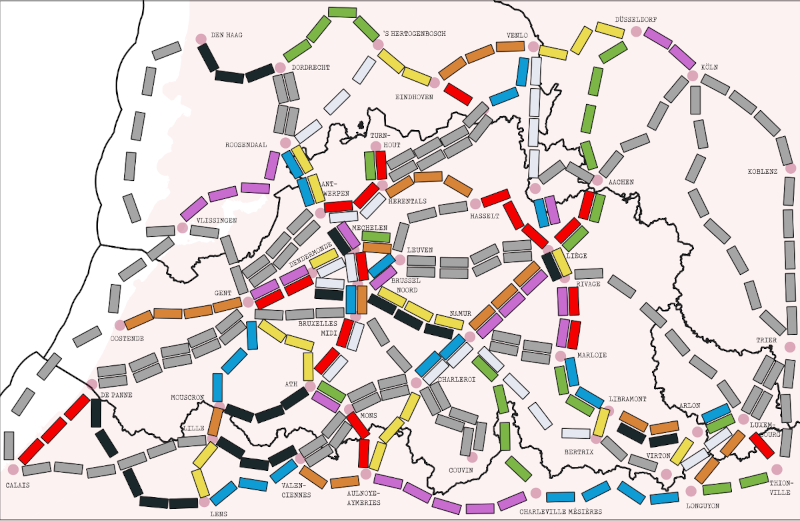
Once the segments and colours were fixed, they were transferred to the digital version too.
The segments and colours being fixed, we could also adapt the digital version of the map accordingly. Rectangles were adjusted and coloured, and also the basemap got some upgrades. It now shows water - both the sea and inland rivers, canals and lakes - and the styling of the countries was improved. The SRTM height data from NASA is the cherry on top. Even if I do say so myself - and I own a lot of board games with maps - this beats any of them in level of detail and sense of reality.
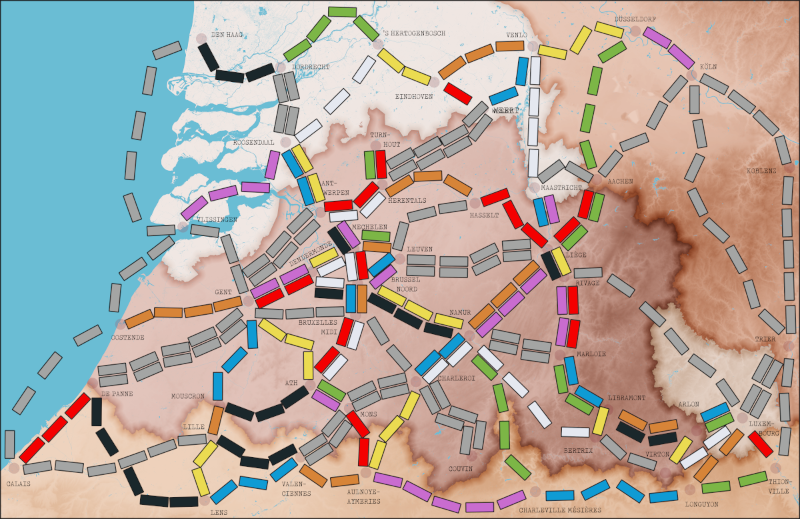
Digital version of the map with improved base map.
With a new map for the game, we also needed new routes. Routes consist of two random cities on the map, which you then have to connect to each other in order to score the points attributed to the route. It does not have to be the shortest connection, any connection will do. The game makes a distinction between long routes and short routes. Each player gets assigned one long route at the start of the game and can then get as many short routes as they like or need.
We realised that also the routes needed some attention for the game to be playable. We needed a number of long routes of a certain length - that also do not overlap too much - and many shorter routes, length-wise distributed similar to the routes of the original game. We also needed to make sure that every station was in at least one route. The number of points that can be scored by a route is the length of the shortest distance (in rectangles) between the two stations and equals the price.
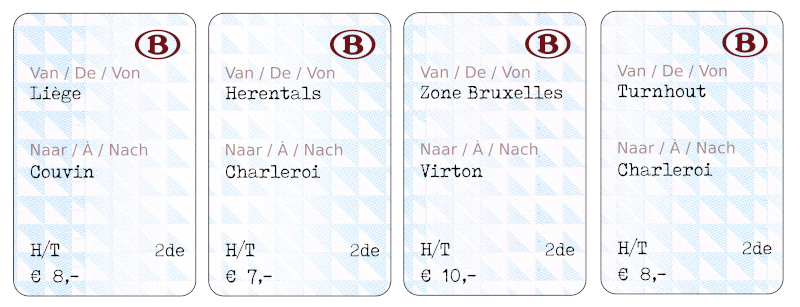
Routes are styled as train tickets. Their price indicates their score, while their class (1st or 2nd) indicates whether it's a long or a short route.
This sounded to me like a routing problem: in fact the game board was a very simple graph network where each intersection is a node and each segment is an edge with a cost equal to the number of rectangles in the segment. I created this network in a table in a PgRouting-enabled database, which then allowed to execute shortest-path queries against it. For example, the database would be able to calculate the shortest distance (in rectangles) between any two stations.
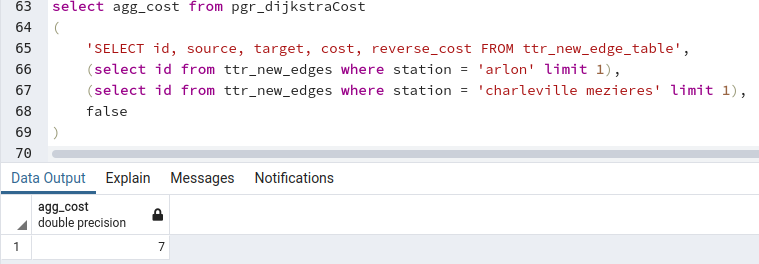
Shortest path query finding the in-game route distance between Arlon and Charleville-Mésières.
With some more complex queries I was able to use this to generate possible routes: you just let PgRouting calculate the shortest distance between any combination of stations and sort them on length. This list then makes the selection of a few long and any number of short routes very easy and also made it easy to have a good route length distribution. Some additional checks were implemented to make sure every station was included in at least one of the routes we selected.
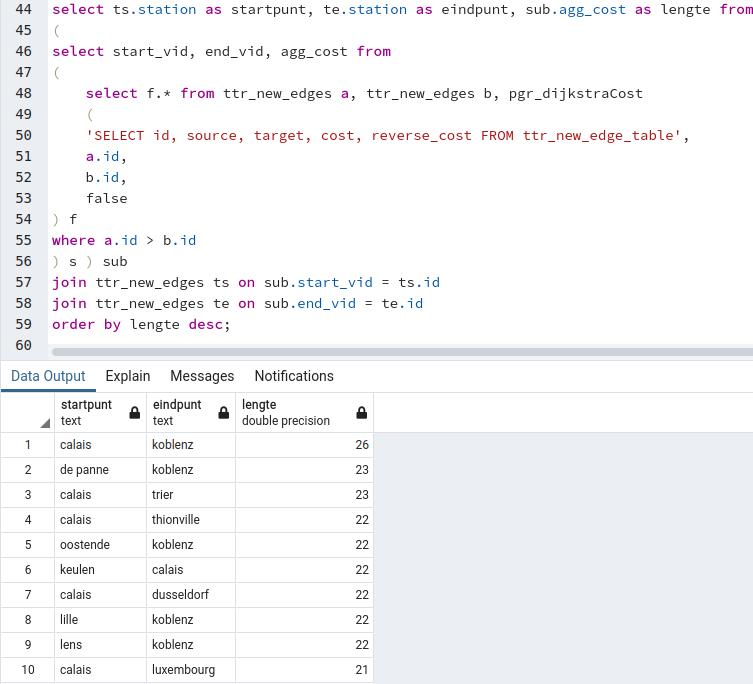
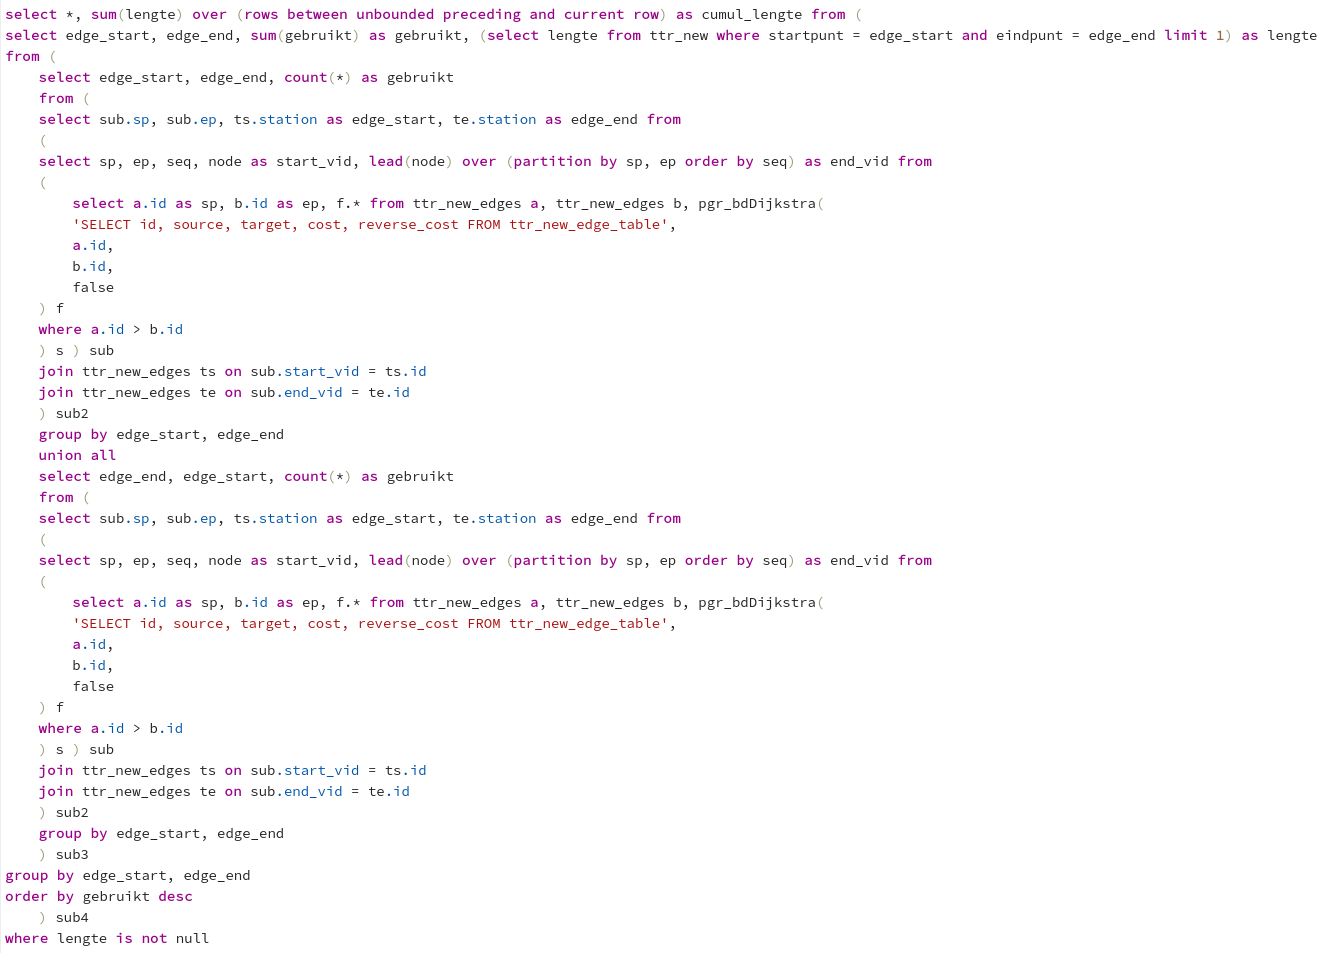
Query to list all available routes in the game, sorted on length.
Finally the routable network allowed for one last optimisation: determining which segments should be duplicated. As you can see on the map, some of the segments are double: they can be used by two players. To identify the segments that qualify for duplication I adjusted the previous query to get all segments used in each route, count how many times a segment was used and sort on that. This list could then be used to double segments until we reached the number of rectangles of the original game.
Query to list the segments that occur in the most routes, sorted on the times a segment belongs to a shortest route.
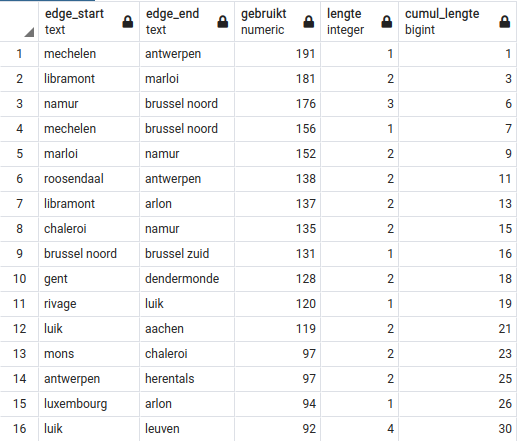
Output of the previous query, showing the most used segments in the game.
The shares are an addition we borrowed from Ticket to Ride Pennsylvania. In short, each segment can be operated by a number of railway companies. When claiming a segment as a player you get a share of one of the companies operating it. In the end points are awarded for the majority shareholders of all companies. This adds an extra element to the game: you have to decide whether to go all-in on a larger company or diversify your shares across multiple, while also impacting your choice of route.
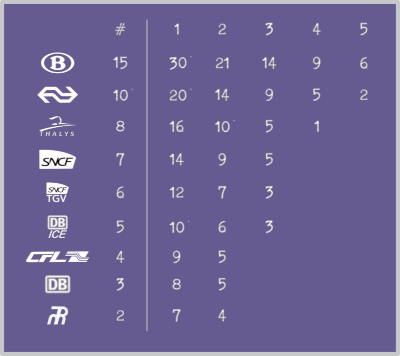
Scoring table of the railway company shares at the end of the game. For each company the table lists the number of available shares, and the score that is awarded to the player with the most shares (rank 1 to 5).
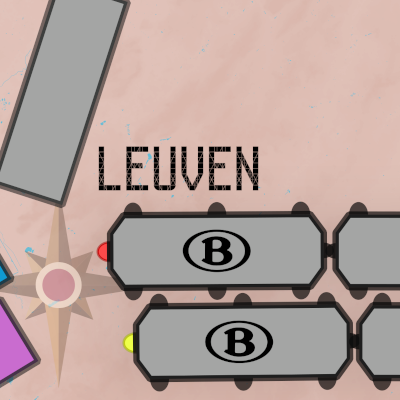
Lastly I want to focus on some details in the board that really finish it off. Obviously the 'Ticket to Ride' on top is styled after the signs you see on the station platform. The cities on the map are marked with the well known NMBS star you can also spot in the Brussels North station, and the font resembles the yellow segment displays found on the platforms announcing the trains.

Ticket to Ride styled after a station sign found at the platforms.
Cities or intersections are styled with the well known NMBS star, also to be found in the Brussels North station. The font resembles the yellow segment displays from the platforms.
Certain rectangles require a locomotive to be handed in in order to use them. Obviously we needed a Belgian one, so I drew a 'Type 18' (NMBS HLE 18 from Siemens). Some segments in the game represent tunnels, so I put lights on the trains to emphasise this - and made sure that they're always using the left track.
Locomotives styled after the common NMBS Type 18 Siemens locomotives.
Tunnels are styled to be recogniseable and sport trains with lights. In Belgium, trains normally use the left track.
Also the scoring panel that shows the number of points you get for each segment - the longer the segment, the higher the score - needed some attention. For each segment length I drew a train with the same number of carriages, consisting of a Type 18 locomotive and M6 carriages, and made sure it was realistic and drive-able in both directions. There is even place for your bike on the longer ones!
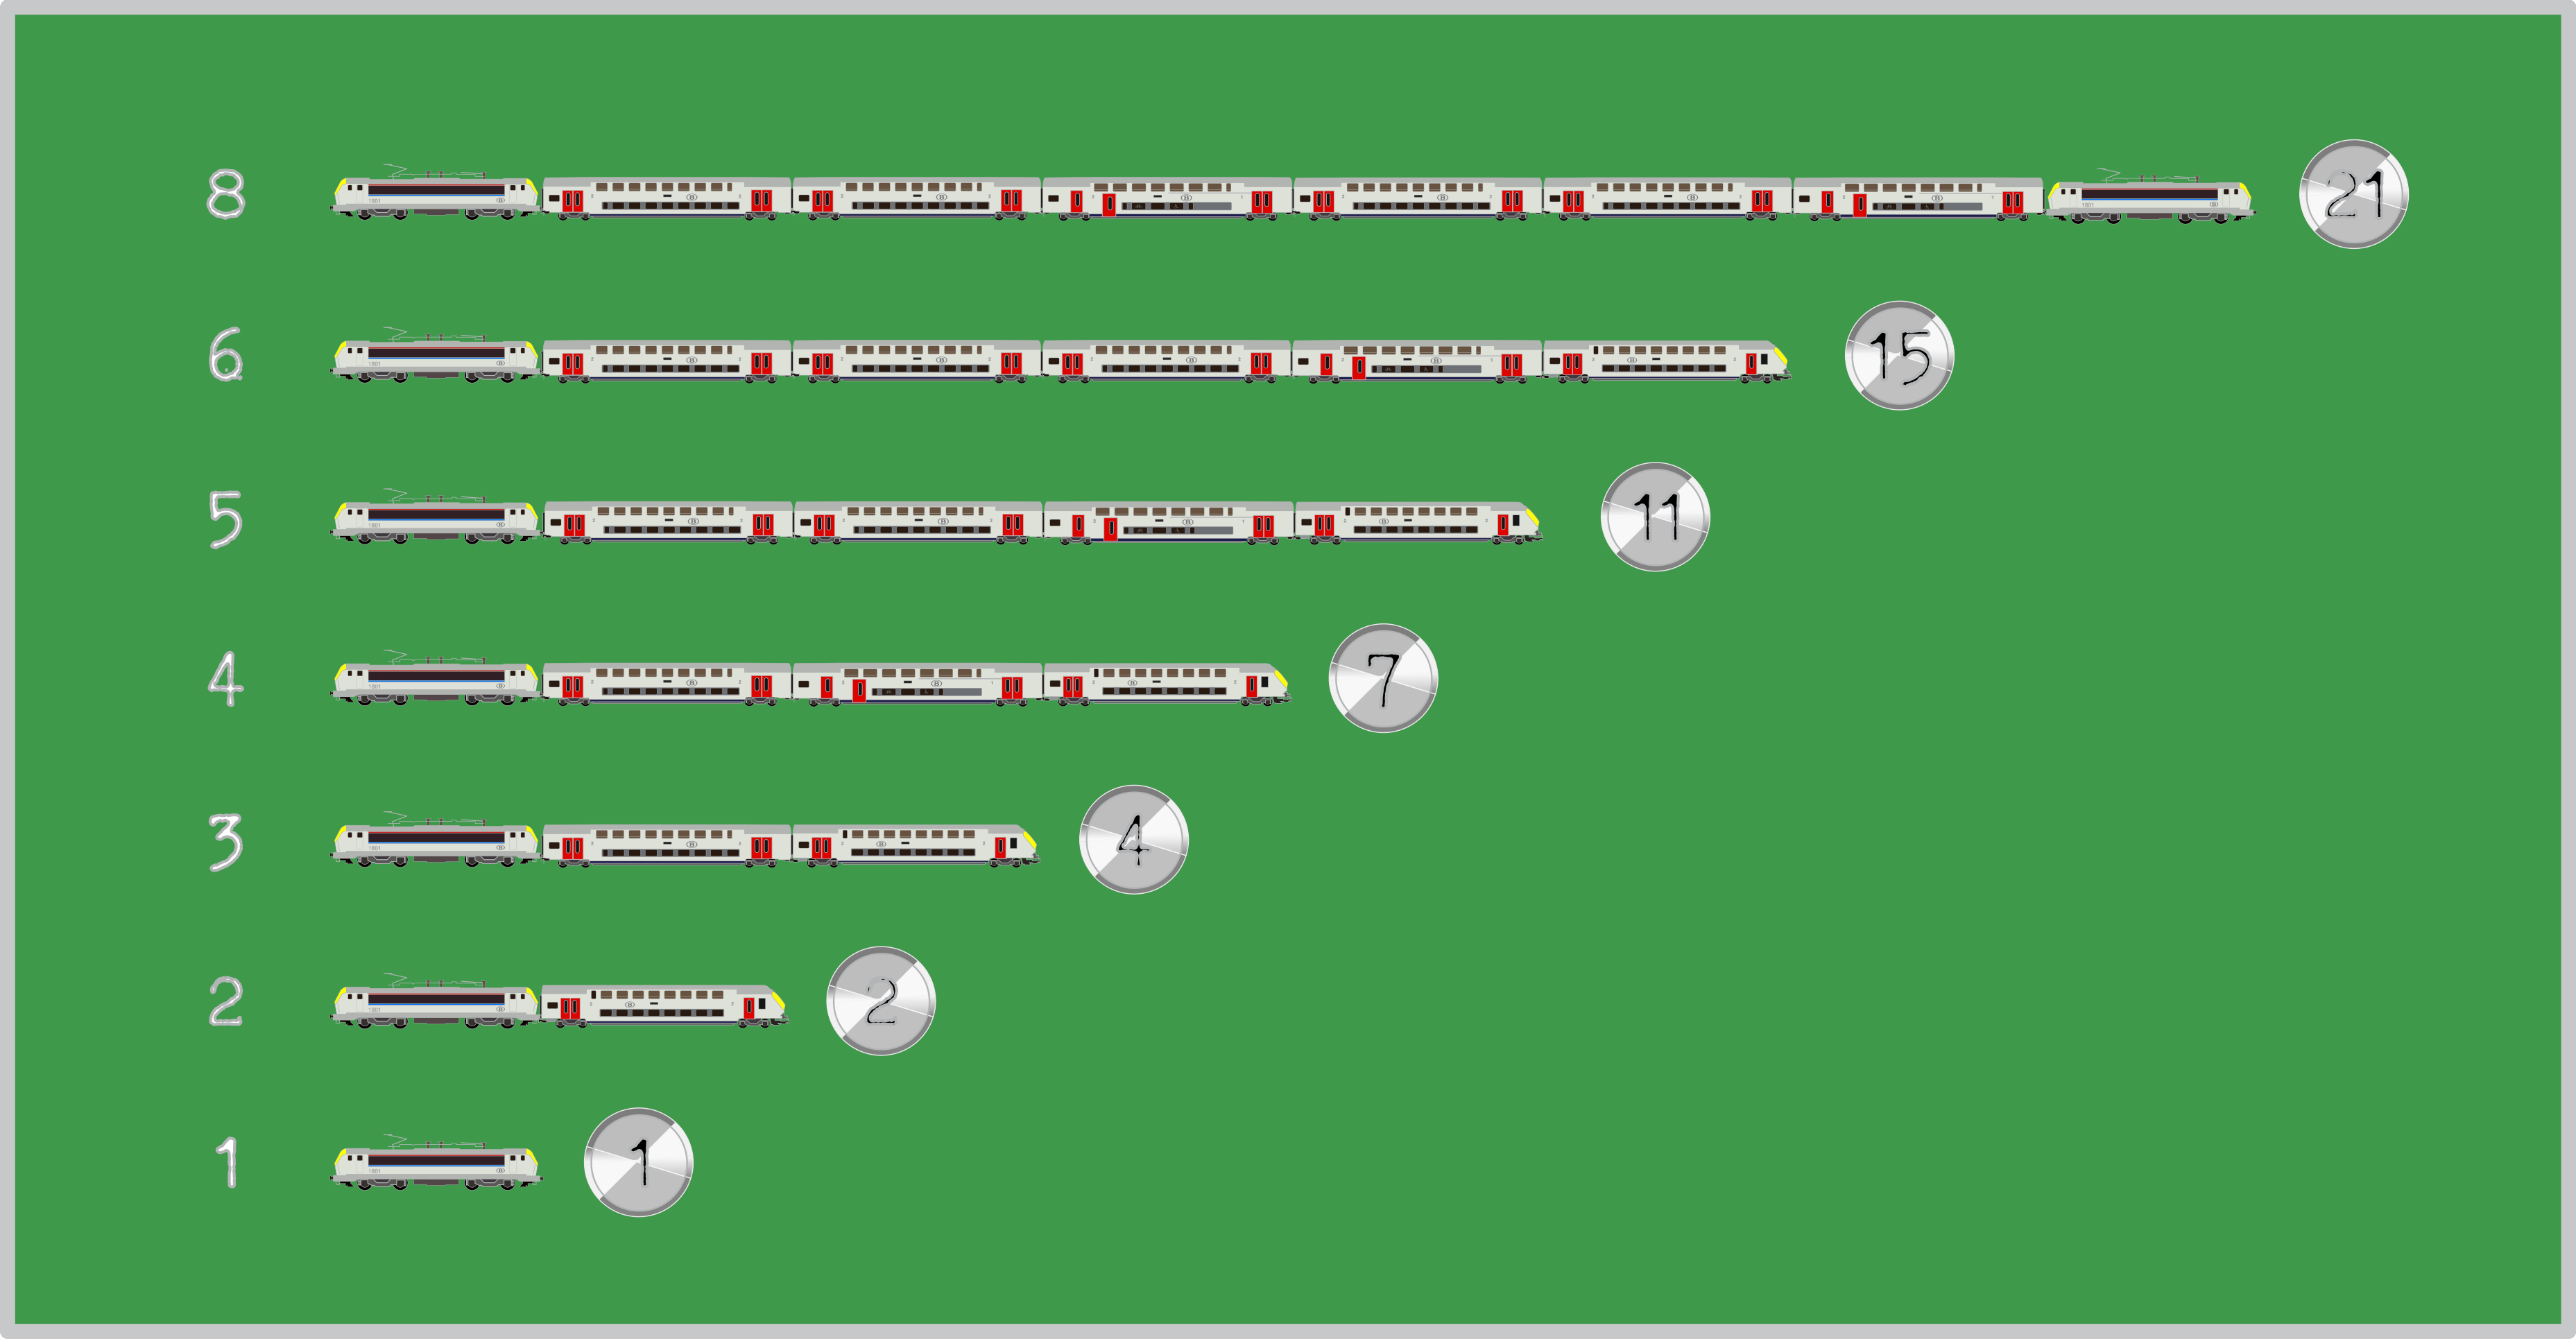
Scoring panel for the segments. Click to enlarge!
— Roel